Table of Contents |
guest 2025-07-11 |
Legend
one_compound
one_environment
About
Data Sources
Terminology
Understanding assertions, compatibility predictions and data viewing features on Web of Microbes
Using the Web of Microbes
Contact
default
one_microbe
Legend
one_compound
one_environment
About
Web of Microbes (WoM): data repository of exometabolomics experiments
These assertions are based on direct experimental evidence obtained through exometabolomic analyses. Currently, the database containes results from carefully curated mass spectrometry datasets from the Northen Metabolomics Lab located at the Joint Genome Institute, a DOE National User Facility of Lawrence Berkeley National Laboratory. WoM captures assertions: metabolite compositions of environments and the changes to metabolite abundances metabolites by organisms in the environment. It is important to note that these transformations are only interpretable in the context of the specific environment since the manner in which an organism may interact with a metabolite in one environment may differ in another.

Kosina SM, Greiner A, Lau RK, Jenkins S, Baran R, Bowen BP, Northen TR. Web of Microbes (WoM): a curated microbial exometabolomics database for linking chemistry and microbes. BMC Microbiology, September 12, 2018. DOI: 10.1186/s12866-018-1256-y
Data Sources
- Kosina SM, Danielewicz MA, Mohammed M, Ray J, Suh Y, Yilmaz S, et al. Exometabolomics Assisted Design and Validation of Synthetic Obligate Mutualism. ACS Synth Biol. 2016;5:569–76. DOI: 10.1021/acssynbio.5b00236.
- Baran R, Brodie EL, Mayberry-Lewis J, Hummel E, Da Rocha UN, Chakraborty R, et al. Exometabolite niche partitioning among sympatric soil bacteria. Nat Commun. 2015;6:8289. DOI: 10.1038/ncomms9289.
- Baran R, Bowen BP, Northen TR. Untargeted metabolic footprinting reveals a surprising breadth of metabolite uptake and release by Synechococcus sp. PCC 7002. Mol Biosyst. 2011;7:3200. DOI: 10.1039/c1mb05196b.
- Erbilgin O, Bowen BP, Kosina SM, Jenkins S, Lau RK, Northen TR. Dynamic substrate preferences and predicted metabolic properties of a simple microbial consortium. 2016. DOI: 10.1186/s12859-017-1478-2.
- Kosina SM, Greiner A, Lau RK, Jenkins S, Baran R, Bowen BP, Northen TR. Web of Microbes (WoM): a curated microbial exometabolomics database for linking chemistry and microbes. BMC Microbiology, September 12, 2018 DOI: 10.1186/s12866-018-1256-y. Data available at https://genome.jgi.doe.gov/portal/ENIBEMetabolites_FD/ENIBEMetabolites_FD.info.html
- Zhalnina, K., Louie, K.B., Hao, Z., Mansoori, N., da Rocha, U.N., Shi, S., Cho, H., Karaoz, U., Loqué, D., Bowen, B.P., Firestone, M.K., Northen, T.R., Brodie, E.L., 2018. Dynamic root exudate chemistry and microbial substrate preferences drive patterns in rhizosphere microbial community assembly. Nature Microbiology 3, 470–480. doi:10.1038/s41564-018-0129-3 DOI: https://doi.org/10.1038/s41564-018-0129-3. Data available at https://www.nature.com/articles/s41564-018-0129-3#Sec23
Terminology
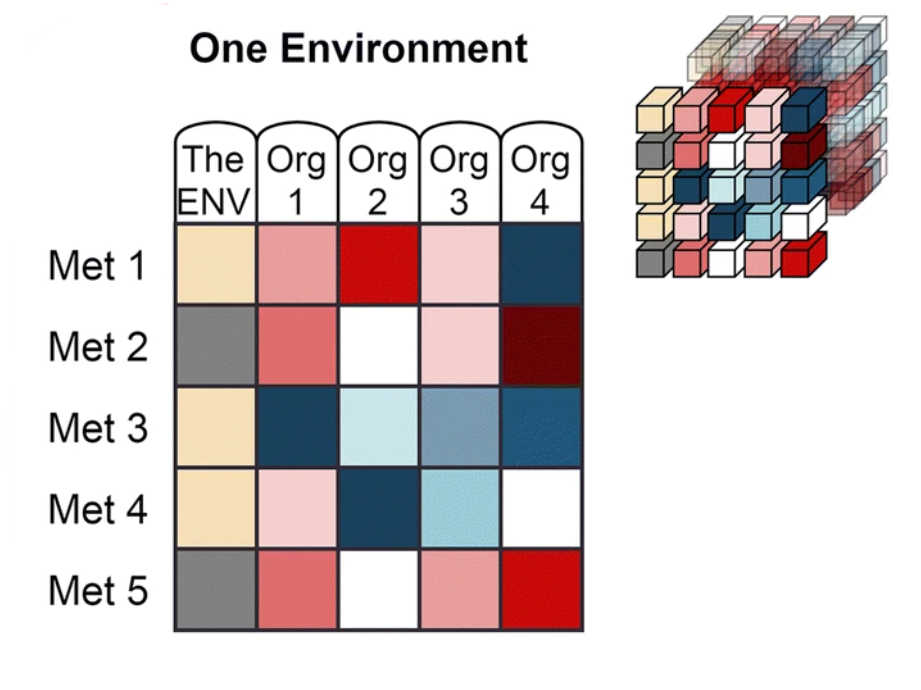
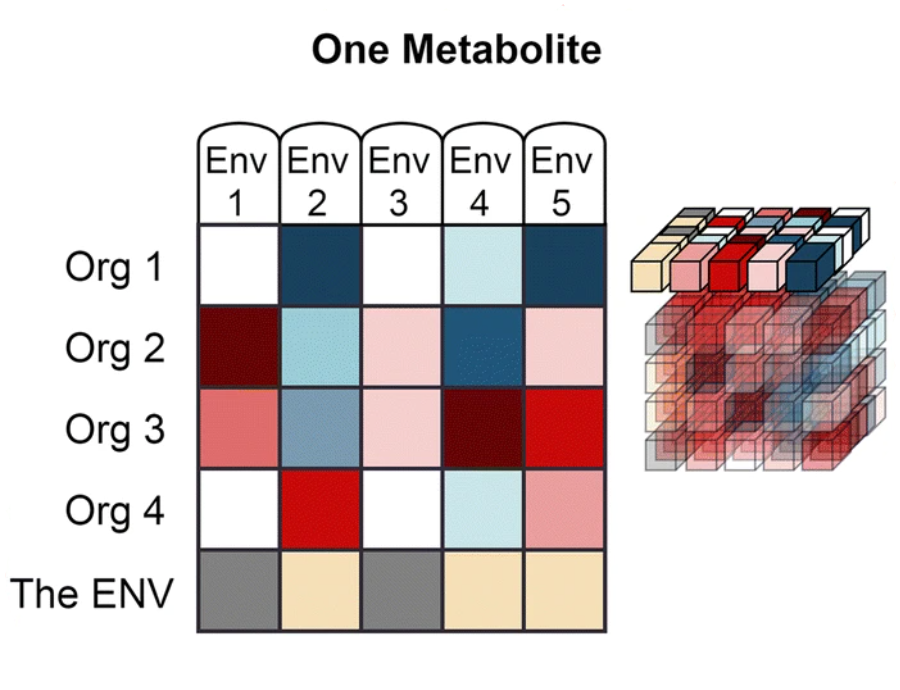
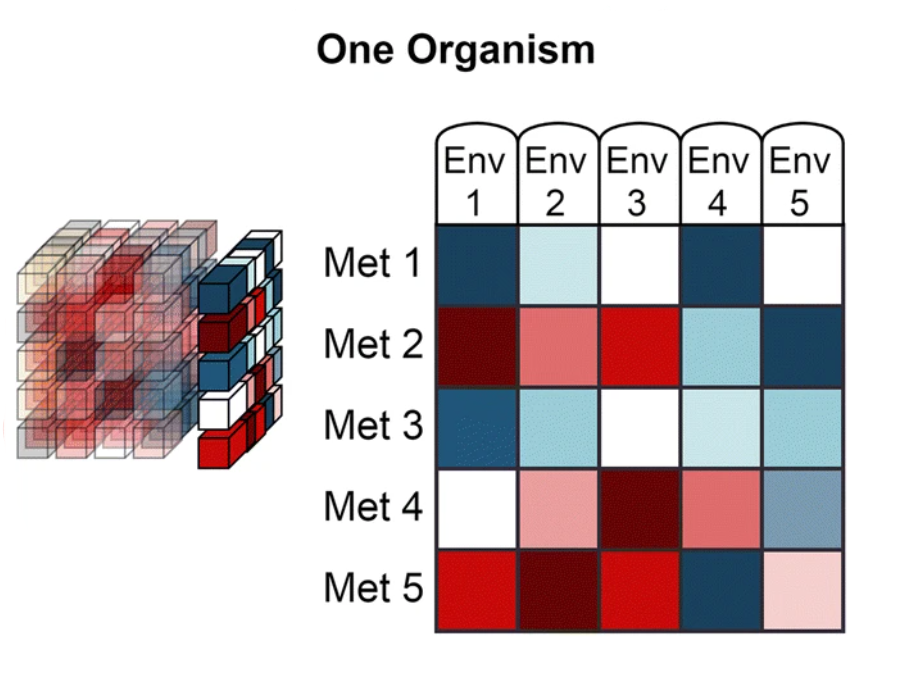
The data from Web of Microbes are represented by three dimensions:
 |
 |
 |
| ‘Environment’ is the starting metabolite pool that is transformed by the organism(s) and may include anything from synthetic mixtures of metabolites, rich medias, plant exudates, microbial extracts, soil extracts, plant materials, etc. |
‘Metabolite’ includes organic compounds that can be accurately identified and measured in comparison of control and transformed environments.
|
‘Organism’ is the transforming agent that results in the increase or decrease of metabolites within an environment and may be a monoculture or consortia of organisms (plants, bacterial isolates, native microbial communities from soil, etc.) |
Understanding assertions, compatibility predictions and data viewing features on Web of Microbes
The WoM features four data viewing tabs: The first, "The Web", links the actions of microorganisms on metabolites from within a single environment. The other three, "One Environment", "One Metabolite" and "One Organism", allow the user to constrain the data to the dimension as indicated on the tab. For example "One Metabolite" will display a table linking the actions of organisms on the user specified metabolite from within multiple environments. These metabolic actions include the increase or decrease of a metabolite after exposure of an environment to a transforming agent (one or more organsims). There are two types of assertions that are made on the WoM:
- Assertions of 'present in environment': The metabolite to be annotated as detected in >2/3 replicates. These are indicated by tan table cells or filled in circles on the web.
- Assertions of 'increase' or 'decrease' by an organism: Metabolites that were significantly different from the control environment versus the transformed environment are asserted as increased (red cells on tables and red lines on The Web) or decreased (blue cells on tables and blue lines on The Web) with darker shading indicating a greater fold change.
Compatibility predictions: On the "One Environment" tab, compatibility scores are calculated to provide either a measure of compatibility between an organism and an environment or between two organisms. Scores are displayed in the column headers after the user selects a reference column by clicking on the column header. The current reference column is marked in yellow, and scores are calculated for all other columns (the scored organsims) in relation to the reference column (reference organism). When "The Environment" is selected as the reference, the Environmental Use Scores are displayed for all scored organisms. When an organsism is displayed as the reference, competition and exchange scores are displayed for all of the scored organsims.
Caveats: Our goal is to make assertions of presence and relative abundances. The shading does not indicate absolute/quantified abundances, thus it is not possible to use the shading to compare abundances of different metabolites (given dramatic differences in certain instrument response functions for metabolites). For example, with mass spectrometry, some abundant metabolites may not be detectable due to poor ionization (e.g. hydrocarbons). Further, the increase/decrease of a metabolite may be due to a number of factors including, for example, active or passive transmembrane transport, extracellular enzymes, and adsorption onto cellular, mineral or culture vessel surfaces.
Using the Web of Microbes
When constraining data to two-dimensional tables or web of assertions, the user must select the value for the constraining dimension
Metabolite names and IDs: Metabolite names are given to the level of structural information available. Typically, we are making identifications from samples based on two orthogonal and independent parameters as compared with pure reference standards. In other cases, where we only have limited evidence for an assignment (for example comparison of sample metabolite with an online spectral database) we are making a putative annotation. Right now, these are indicated with parentheses around the metabolite name. In other cases, where only limited structural information is available, a chemical formula, detection value (retention time + m/z) or chemical class is used as the metabolite name.
Understanding assertions, compatibility predictions and data viewing features on WoM
The WoM features data viewing tabs: "One Environment", "One Compound" and "One Organism" allow the user to constrain the data to the dimension as indicated on the tab. For example "One Compound" will display a table linking the actions of organisms on the user specified metabolite from within multiple environments. These metabolic actions include the increase or decrease of a metabolite after exposure of an environment to a transforming agent (one or more organisms). There are two types of assertions that are made on the WoM:
- Assertions of 'present in environment': The metabolite to be annotated as detected in >2/3 replicates. These are indicated by tan table cells or filled in circles.
- Assertions of 'increase' or 'decrease' by an organism: Metabolites that were significantly different from the control environment versus the transformed environment are asserted as increased (red cells on tables and red lines) or decreased (blue cells on tables and blue lines) with darker shading indicating a greater fold change.
Caveats: Our goal is to make assertions of presence and relative abundances. The shading does not indicate absolute/quantified abundances, thus it is not possible to use the shading to compare abundances of different metabolites (given dramatic differences in certain instrument response functions for metabolites). For example, with mass spectrometry, some abundant metabolites may not be detectable due to poor ionization (e.g. hydrocarbons). Further, the increase/decrease of a metabolite may be due to a number of factors including, for example, active or passive transmembrane transport, extracellular enzymes, and adsorption onto cellular, mineral or culture vessel surfaces.
Contact
To contact us with questions, comments, or requests for submitting data, please email webofmicrobes@lbl.gov.
default
Understanding assertions, compatibility predictions and data viewing features on WoM
The WoM features data viewing tabs: "One Environment", "One Compound" and "One Organism" allow the user to constrain the data to the dimension as indicated on the tab. For example "One Compound" will display a table linking the actions of organisms on the user specified metabolite from within multiple environments. These metabolic actions include the increase or decrease of a metabolite after exposure of an environment to a transforming agent (one or more organisms). There are two types of assertions that are made on the WoM:
- Assertions of 'present in environment': The metabolite to be annotated as detected in >2/3 replicates. These are indicated by tan table cells or filled in circles.
- Assertions of 'increase' or 'decrease' by an organism: Metabolites that were significantly different from the control environment versus the transformed environment are asserted as increased (red cells on tables and red lines) or decreased (blue cells on tables and blue lines) with darker shading indicating a greater fold change.
Compatibility predictions: On the "One Environment" tab, compatibility scores are calculated to provide either a measure of compatibility between an organism and an environment or between two organisms. Scores are displayed in the column headers after the user selects a reference column by clicking on the column header. The current reference column is marked in yellow, and scores are calculated for all other columns (the scored organisms) in relation to the reference column (reference organism). When "The Environment" is selected as the reference, the Environmental Use Scores are displayed for all scored organisms. When an organism is displayed as the reference, competition and exchange scores are displayed for all of the scored organisms.
Caveats: Our goal is to make assertions of presence and relative abundances. The shading does not indicate absolute/quantified abundances, thus it is not possible to use the shading to compare abundances of different metabolites (given dramatic differences in certain instrument response functions for metabolites). For example, with mass spectrometry, some abundant metabolites may not be detectable due to poor ionization (e.g. hydrocarbons). Further, the increase/decrease of a metabolite may be due to a number of factors including, for example, active or passive transmembrane transport, extracellular enzymes, and adsorption onto cellular, mineral or culture vessel surfaces.